
Seven years of great abundance are coming throughout the land of Egypt, but seven years of famine will follow them. (Genesis 41:29-30)
The book of Genesis provides a good description of the ‘second dimension’ that I have been using to analyze words in the New Year addresses. This dimension distinguishes between years of abundance and years of famine – in other words, it separates the economically robust years and the economically challenging years. In Figure 1 (which repeats Figure 1 from the previous post), the second dimension is the vertical dimension of the map. The years shown nearer the top are years of abundance and the years shown nearer the bottom are years of famine. Note that the Soviet years to the left are mostly grouped together and located in the middle of the figure. The Perestroika years in the center are mostly located closer to the bottom than the Soviet years, because those years of reformation are related to economic difficulties. The post-Soviet years on the right-hand side of the graph are more spread out than the other two clusters. Several years in this group, i.e., 1991, 1996, and 1999, are outliers at the bottom of the map. These three years are years of significant overturn in Russian history, both politically and economically speaking.
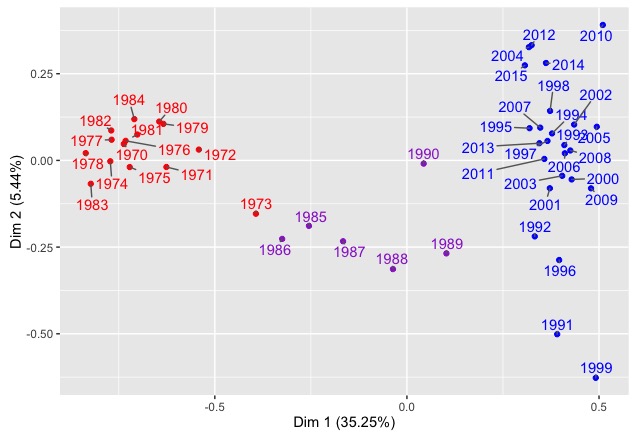 Figure 1. New Year addresses by year: Soviet period (red), Perestroika (purple), and post-Soviet period (blue).
Year 1991 is the year of the dissolution of the Soviet Union, which occurred due to, among other reasons, economic crisis. Year 1996 was a year of presidential elections, and at that time, many workers had not been paid for months. One of the largest miners’ strikes took place in 1996 because miners were owed $200 million in unpaid wages.1 Year 1999 immediately followed the 1998 economic crisis and was a year that witnessed apartment bombings in Moscow, the start of the Second Chechen War, and was the year Yeltsin resigned as President. The years at the top of the map are years of relative economic prosperity.
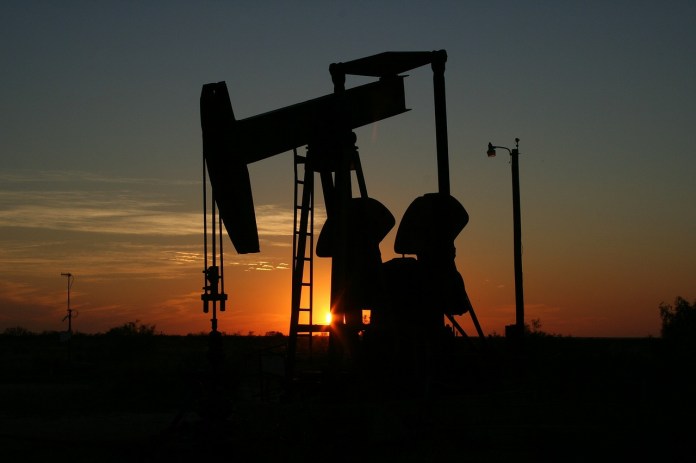
The prosperity and economic stability of Russia are strongly dependent on oil, which is Russia’s most important export commodity. Dimension 2 is correlated with the price of a barrel of oil2 (r = 0.42, P-value = 0.004). This dependency is not surprising at all. Most economic crises and associated non-economic crises in the USSR and Russia were related to the fall in oil prices. First, in 1979, the USSR’s economy already was struggling to pay for the effects of its planned economy. This crisis is summarized in the 1979 report from the Assistant to the Chairman of the Council of Ministers of the USSR, N. Kirillin, but was ignored at the time since the high oil prices provided an easily available economic resource.3 The Soviet Union’s ‘business’ scheme at the time was for the country to extract and sell oil. Fuel energy amounted to 16 percent of the export in 1970, but was already at 54 percent in 1985. The money received from the sale of oil was used to buy food: grain imports were 2,2 million tonnes in 1970, but reached 45,5 million tonnes in 1985, and meat imports were 165 thousand tonnes in 1970, but increased to 857 thousand tonnes in 1985.4
Oil prices in general are known to reflect important historical events, especially those that occur in regions that are highly dependent on oil production. For example, oil prices peaked during the Yom Kippur War (1973) and the Gulf War (1990-1991). Oil prices also increased during the Iranian Revolution (1979) and at the beginning of the Iran/Iraq War (1980). However, these increases were followed by the most significant decrease in oil prices in the second half of the 20th century. The adjusted price of a barrel of oil fell from $115.62 in April 1980 to $22.33 in March 1986. When the price of oil fell, inevitable changes in the ways the USSR’s economy functioned started to take place, and Perestroika began.
The economy of modern Russia depends on oil and gas even more strongly than it did in the Soviet Union. Now, oil and natural gas sales account for 70 percent of Russia’s exports,5 so it is not surprising that every significant change in oil prices has an effect on the Russian economy. Note the years 2001 and 2009 at the bottom of the blue cloud of years presented in Figure 1. Both years are associated with significant decreases in oil prices.
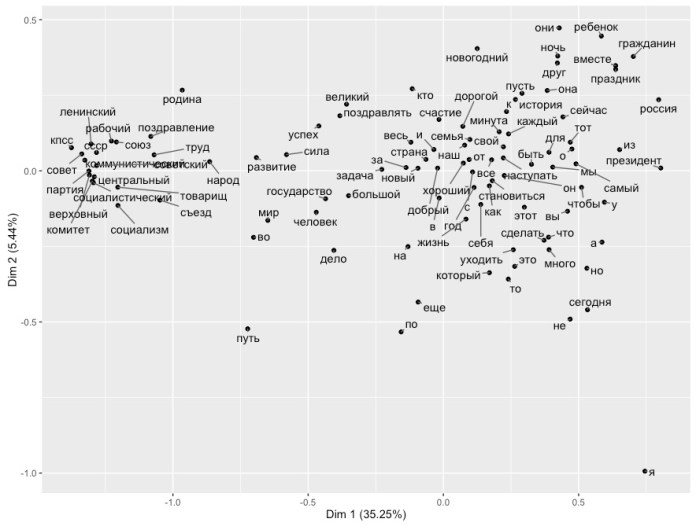 Figure 2. Words used in the New Year addresses: Dimensions 1 and 2.
In Figure 2 (which repeats Figure 2 from the previous post), we can see words that are attracted to and repulsed from Dimension 2. At the bottom we see words that occur more frequently in years of famine. The most prominent is the pronoun ja ‘I’ in the right bottom corner of the map. In addition to ja ‘I’, we see segodnja ‘today’, put’ ‘way, track’ and delo ‘work’. In times of crisis, leaders often talk about circumstances that are behind us or in front of us, and about the work ahead that already has begun or must be done in the future. See two characteristic quotes from a speech by Yeltsin delivered in 1991:
(1) Не вина России, что ее столкнули с этого пути, превратили в испытательный полигон коммунизма. Сегодня мы избавились от этого наваждения.
‘It is not Russia’s fault that it was pushed off this track, and was turned into testing grounds for communism. Today we are free from this nightmare.’
(2) Мы вместе решились на перемены, вместе начали дело, которое, может быть, станет главным для России XX века.
‘We together decided to start changes; we together started the work that maybe will become the most important for the Russia in the twentieth century.’
At the top of the map we see words such as pust’ ‘let’, rebenok ‘child’, novogodnij ‘New Year’s’, drug ‘friend’, vmeste ‘together’, prazdnik ‘holiday’, sem’ja ‘family’, which together create a picture of a large family enjoying a New Year’s Eve meal. During economically robust years, leaders of Russia are inclined to talk about family values. A quote from Medvedev’s 2010 address in (3) and a quote from Putin’s 2012 address in (4) illustrate this tendency.
(3) И всё, что мы делаем, мы делаем для наших детей – для того, чтобы они были здоровы, чтобы у них в жизни всё получалось, чтобы они жили в безопасной, благополучной и счастливой стране…
‘Everything that we do, we do for our children – so that they will be healthy, so that they will succeed in life, so that they will live in a safe, successful, happy country…’
(4) В эти минуты мы особенно остро чувствуем, как летит время, как быстро растут наши дети, как дорожим мы своими родными и близкими, как любим их.
‘In these moments we especially feel how the time flies, how fast our children grow, how much we appreciate our friends and family, how we love them.’
Thus, we see that the 100 most frequent words in the New Year addresses can capture differences in rhetoric that are associated with years of hardship and years of abundance. Also, we see that the second dimension correlates with the adjusted price of a barrel of oil, because oil is Russia’ most important export commodity and its price greatly influences Russia’s economy. The next post will be about the dimension that is correlated with democratic freedom.
[1] Alessandra Stanley. Russian Miners Strike, Defying Yeltsin. The New York Times. February 2, 1996. http://www.nytimes.com/1996/02/02/world/russian-miners-strike-defying-yeltsin.html
[2] Adjusted for inflation.
[3] See Gajdar, Egor. 2005. Dolgoe vermja. Moscow: Delo, p. 337.
[4] Ibid. p. 340.
[5] Oil and natural gas sales accounted for 68% of Russia’s total export revenues in 2013. U.S. Energy Information Administration. July 23, 2014. http://www.eia.gov/todayinenergy/detail.cfm?id=17231. Accessed at May 27, 2016; Will Russia Survive the Oil & Gas Downturn? Oil&Gas 360. October 15, 2015. http://www.oilandgas360.com/will-russia-survive-the-oil-gas-downturn/. Accessed at May 27, 2016.


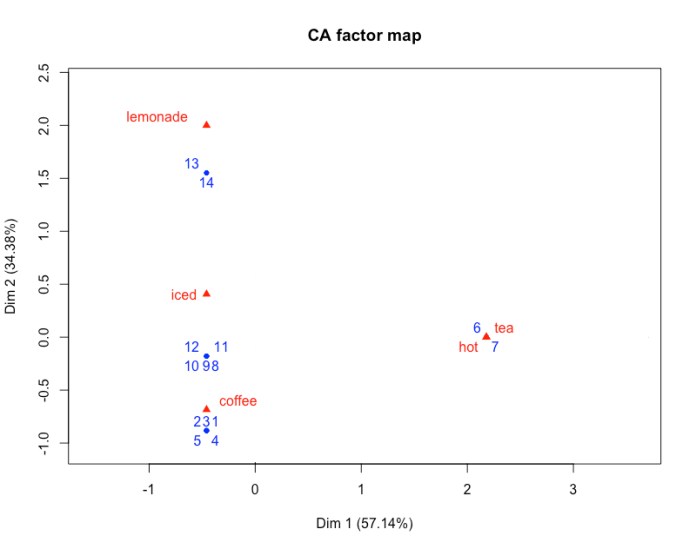 Figure 1. Groups of days according to drinks purchased on that day.
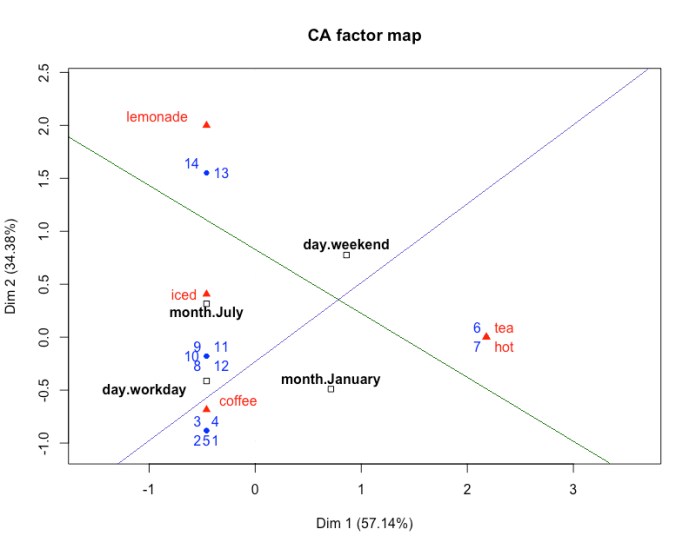 Figure 2. Major factors in a day’s distribution.
 only with the past. For me, this was my first experience working with microfilm. In order to access the collection, I had to use a special designated elevator to the basement of the building, which only the people who wanted to access microfilm were allowed to use. The staff members there were delighted to see someone at all and seemed to enjoy helping me learn how to view microfilm on the screen of the reader (similar to the one shown to the right) and how to convert the images on the screen to pdf files. I typed in all the New Year’s Eve addresses from 1970 to 1991 using those copies.
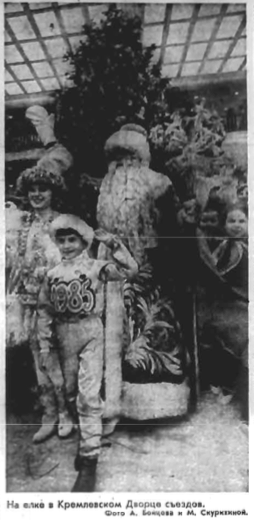 front page. For example, pictures in the January 1 editions tell their own story. In the newspapers from 1971 to 1984, the New Year’s Eve addresses sometimes were accompanied by a picture of the leader, however most often they were printed next to an impersonal picture, such as a photograph of the Spasskaya tower with the Kremlin clock or a drawing of a hammer and sickle in front of the clock. Year 1985 was the first year since 1971 when ordinary people appeared in the front page photo of Pravda on January 1. The photo from the front page of that year shows traditional participants of the New Year celebration in front of the Kremlin Palace of Congresses. It portrays Ded Moroz (a fictional character similar to Father Christmas), Snegurochka (the Snow Maiden), and a boy who represents the New Year. Later that year (1985), Gorbachev came into power and started a process that eventually led to “socialism with a human face”, but apparently something was already in the air on the eve of 1985, inadvertently evidenced by Pravda’s front page photo. This change opened doors to other changes, which eventually led to the New Year address no longer appearing in Pravda seven years later.